Optimize Strategies with Linear Regression Analysis 📊
A Practical Guide to Isolating the Impact of Efforts on Outcomes
Hello, data-driven and curious minds, welcome to the 19th edition of DataPulse Weekly!
One of the most challenging problems that businesses face is attributing purchases to the right channel. While there are usually MMPs (Mobile Measurement Partners) to attribute mobile purchases and UTMs to attribute website purchases, there are often limitations in identifying the exact source of the purchases.
Consider a company that consistently engages in the following activities:
Onboard influencers to promote its products on Instagram 🕺
Run performance marketing ads on search ads, YouTube ads, Instagram ads, and TikTok ads. 📷
Run automated email marketing journeys 📨
Sends cart abandonment app notifications 🛒
Make sales pitches through the sales team 🛍️
Regularly publish social media posts 🚩
And more!
Often sales attribution is a multi-touchpoint problem. A user might see a performance marketing ad on Instagram → Visit the company’s Instagram page → Search the Company on Google → Click on Search Ads → Make a purchase.
There are namely 3 popular attribution models: First-click, last-click, and multi-touchpoint. However, attribution is challenging as stakeholders from each function claim credit for driving purchases.
In such cases, backend tracking is crucial as it ensures sources are exclusive and exhaustive, but the contribution of touchpoints from various marketing efforts cannot be overlooked.
Businesses must address several critical questions:
Should we increase the email notification frequency to boost purchases?
Does TikTok offer a higher ROI compared to Instagram Reels?
Can influencer marketing and Google search ads work in tandem?
This is where Linear Regression proves invaluable. It is a powerful statistical technique that models the relationship between a dependent variable (e.g., purchases) and one or more independent variables (e.g., marketing spending on various channels). It helps us quantify the impact of each marketing channel on purchases.
Consider the below data for the above example (Limiting to a few variables for simplicity):
Let's first examine the correlation to identify the relationships between the variables. If you haven't read our last post on correlation, we recommend checking it out here:
Below are the correlations between the dependent variable (purchases) and the independent variables:
Influencer spend <> Purchases: 0.8259
Search Ads <> Purchases: 0.5302
Email Opens <> Purchases: 0.8687
Each variable has a strong correlation. So, we can deep-dive more into it and start looking into linear regression to isolate the impact of each factor on overall purchases. Since we have more than one independent variable, it is a case of multiple linear regression.
Linear Regression Assumptions
Before we can perform regression analysis, we need to check the following assumptions (This will help you to avoid mistakes when using linear regression model, we promise):
Linearity: The relationship between each predictor (Influencer Spend, Search Ads Spend, Email Opens) and the outcome (number of purchases) should be linear. This means that as we spend more on influencers or search ads, or get more email opens, purchases should increase or decrease in a straight-line manner.
Independence: Each data point should be independent. For example, the purchases from one week should not directly influence the purchases of another week. This ensures that our predictions are based solely on the input variables and not influenced by other factors.
Homoscedasticity: The spread of data points around the regression line should be consistent across all levels of spending and email opens. This means the variability of purchases should be similar regardless of how much you spend on influencers or search ads or how many emails are opened.
Normality of Errors: The errors (differences between the predicted and actual purchases) should follow a normal distribution. This implies most of the prediction errors should be small, with fewer large errors, forming a bell curve when plotted.
No Multicollinearity: The predictor variables should not be too closely related to each other. For instance, Influencer Spend and Search Ads Spend should each contribute unique information about purchases. If they are highly correlated, it could distort the model's predictions.
Multiple Linear Regression Model
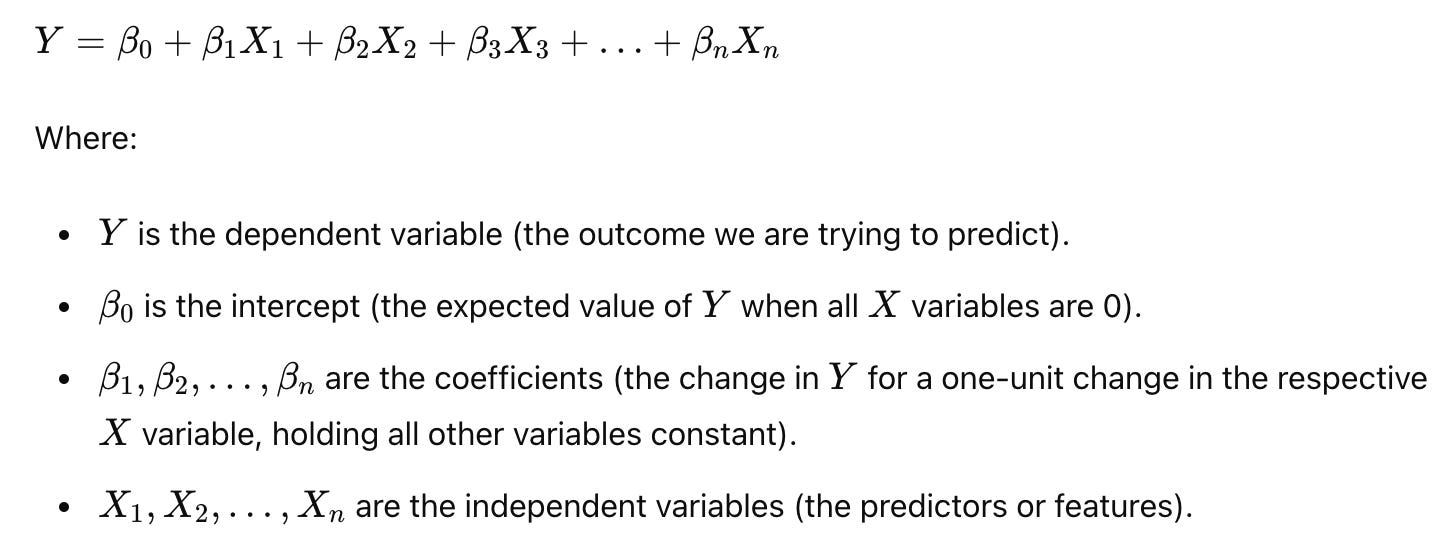
The multiple linear regression model uses the following formula:
Linear Regression Equation and Explanation
The linear regression equation for the given data is as follows:
Purchases= 2638.92+ (0.3229 × Influencer Spend) + (0.1191 × Search Ads Spend) + (0.5089 × Email Opens)
Explanation
Intercept (2638.92): This is the baseline purchase value when all the predictor variables (Influencer Spend, Search Ads Spend, Email Opens) are zero. It represents the starting point of the purchases when no money is spent on any of the advertising channels.
Coefficient for Influencer Spend (0.3229): For every additional dollar spent on Influencer Marketing, purchases increase by approximately 0.3229, holding other variables constant.
Influencer Spend: Spending on influencer marketing positively impacts sales, but the impact is relatively moderate compared to other channels.
Coefficient for Search Ads Spend (0.1191): For every additional dollar spent on Search Ads, purchases increase by approximately 0.1191, holding other variables constant.
Search Ads Spend: Spending on search ads also positively impacts sales, but its effect is smaller than that of influencer marketing and email opens.
Coefficient for Email Opens (0.5089): For every additional email opened, the purchases increase by approximately 0.5089, holding other variables constant.
Email Opens: The number of emails opened has the highest positive impact on sales among the three channels.
These coefficients help identify which advertising channels are most effective and can guide resource allocation for marketing strategies. However, it's important to note that the law of diminishing returns may cause additional spending to yield progressively smaller gains.
Evaluating the Model: Key Performance Metrics
To evaluate the performance of the linear regression model, we look at several key metrics:
Here is a live illustration of MSE.
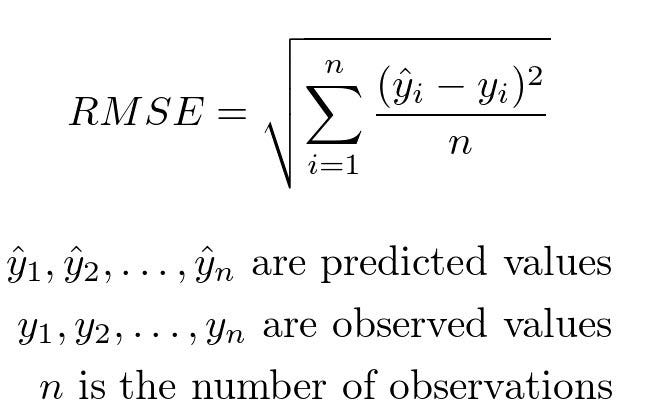
RMSE can be calculated as follows:
To learn more about test statistics for linear regression, visit this link. For the Python code for the sample data in this post, click here.
Conclusion
Linear regression is a practical tool for understanding and optimizing various business efforts. By quantifying the impact of different factors on outcomes, we can make data-driven decisions to allocate resources more effectively and maximize ROI.
For example:
Marketing Optimization: We can determine which marketing channels (e.g., social media, email campaigns, search ads) most significantly drive sales, allowing them to allocate budgets more effectively and increase conversion rates.
Sales Forecasting: By analyzing historical sales data and related factors, We can predict future sales trends, helping them manage inventory, staffing, and production schedules more efficiently.
Customer Retention: By examining customer interaction data, We can identify key factors that influence customer loyalty and develop strategies to enhance retention rate
Tell us in the comments if you know of any interesting examples where linear regression has helped solve a problem.
Remember, while linear regression provides valuable insights into relationships between variables, it is essential to consider the assumptions and evaluate the model thoroughly to ensure accurate and reliable results. Also, keep in mind that linear regression does not necessarily imply causation.
That wraps up our newsletter for today! If you found this valuable, please consider subscribing and sharing it with a friend—it motivates us to create more content.
Stay curious and connected!
Until next Tuesday!
Recommended Next Read:


Educational 👍🏻
Nicely explained!