How Your Uber Finds You: A Data Story 📍🚗
Exploring the unseen: uncovering how data molds our reality, sways choices, and unlocks insights into human psychology!
Today’s Data Menu
Data Case Study: How Uber uses data to enhance the ride-hailing experience
Metric of the Week: ARPU and Its Importance
Visualization Spotlight: Uber’s Surge Pricing Hours
Human Bias Focus: Framing Effect
Data Nuggets: Law of Large Numbers
Data Case Study:
Have you ever thought about how a simple tap on your phone brings a car to you? Or how, with just a tap, you can skip the wait and zoom straight to where you need to be? Let’s get into something super cool in this edition of our newsletter. 🚗
We're talking about Uber - yes, the app that redefined ride-hailing. But it’s not just about getting from place A to place B. There’s a whole world of data crunching and decision-making behind the scenes. 👨💻
At the core of Uber lies its Marketplace, a sophisticated system designed to efficiently and safely match riders with drivers. The Marketplace relies on machine learning algorithms to predict demand, set dynamic pricing, and match drivers with riders in real time. This system continually learns and adapts to ever-changing real-world conditions.
Buckle up as we explore the tech behind every tap on your Uber app! 👇
Okay, so how does Uber always seem to have a car just when and where you need one? Demand forecasting is a critical aspect of Uber's operational strategy, enabling the company to predict how many riders might need a ride in different areas at different times. This forecasting helps Uber ensure that enough drivers are available to meet demand, thereby reducing wait times for riders and optimizing earnings for drivers.
A key tool in demand forecasting is the time series forecasting model, and one of the most popular models used is ARIMA, which stands for AutoRegressive Integrated Moving Average. While the name might seem complex, we're here to demystify it for you. ARIMA is renowned for its ability to analyze and predict time-based data by combining three crucial components: AutoRegressive, Integrated, and Moving Average.
Looking Back to Predict Forward (AutoRegressive): First, we take a close look at when people needed rides in the past. For instance, if we see that every Friday the number of rides spikes, we use that pattern to guess that next Friday will probably be busy too. It's like noticing that every time it rains, more people buy umbrellas, so you stock up on umbrellas when the weather forecast says rain.
Smoothing Out the Ride Data (Integrated): Sometimes, the number of rides goes up and down a lot, which can make it hard to see the real trends. So, we adjust the data to make these trends clearer. Imagine you're tracking the height of a plant. Instead of noting how tall it is every day, you note how much it grows each day. This way, you focus on the growth pattern, not just the size.
Learning from Mistakes (Moving Average): Finally, we improve our predictions by looking at times when our past predictions were off. If we thought 100 people would need rides but only 80 did, we figure out why we were off by 20 and use that knowledge to make better guesses next time. It's like tweaking your recipe a bit each time you bake cookies, based on how the last batch turned out, to get the perfect cookie.
By combining these steps, ARIMA helps Uber predict future ride needs more accurately. We look at past trends, smooth out the data for a clearer view of those trends, and adjust our predictions based on what we've learned from past mistakes.
📈 Takeaway
Having a good forecasting model is crucial for a business because it's like having a crystal ball that helps predict the future. It allows a business to make smart decisions about how to manage its resources, like money, products, and people. For example, if a toy store knows that a certain toy is going to be super popular during the holiday season, it can order more of that toy in advance. This way, the store doesn't run out of stock when everyone wants to buy it, and they can make more sales.
Machine learning might seem like a complicated topic, but it gets much easier when you break it down into simple ideas. If you're a Product Manager who wants to use data to make predictions, a Business leader looking to make smarter decisions, a CXO who wants to lead with the help of data, someone who loves working with numbers, or a Data Analyst wanting to improve your skills — we're here to make these ideas easy to understand. Knowing the basics will help you come up with new ideas in your area, create solutions, grow your business, and make confident decisions based on data. We want to help you use machine learning in your work, turning what seems complex into a chance to do great things. This brings us to the concept of ARPU and its pivotal role in Uber's success.
Metric of the Week: Average Revenue Per User (ARPU)
ARPU measures the average amount of revenue a company earns from each user over a specific period, like a month or a year. This metric is a big deal because it gives businesses a clear picture of how valuable each customer is to their business. For companies, especially those in the tech and service sectors, understanding ARPU is key to crafting strategies that boost profitability. It helps them identify which products or services are hits (or misses) and tailor their offerings to maximize revenue.
ARPU = Total Revenue in a Specific Period / Number of Active Users in That PeriodIn the case of Uber, ARPU tells them how much each rider contributes to the business and identifies profitable markets, user segments, and ride types. For example - Uber recognized a segment of users who were willing to pay more for comfort and convenience and launched UberXL and Uber Black in 2014, having a direct impact on their ARPU. 💸
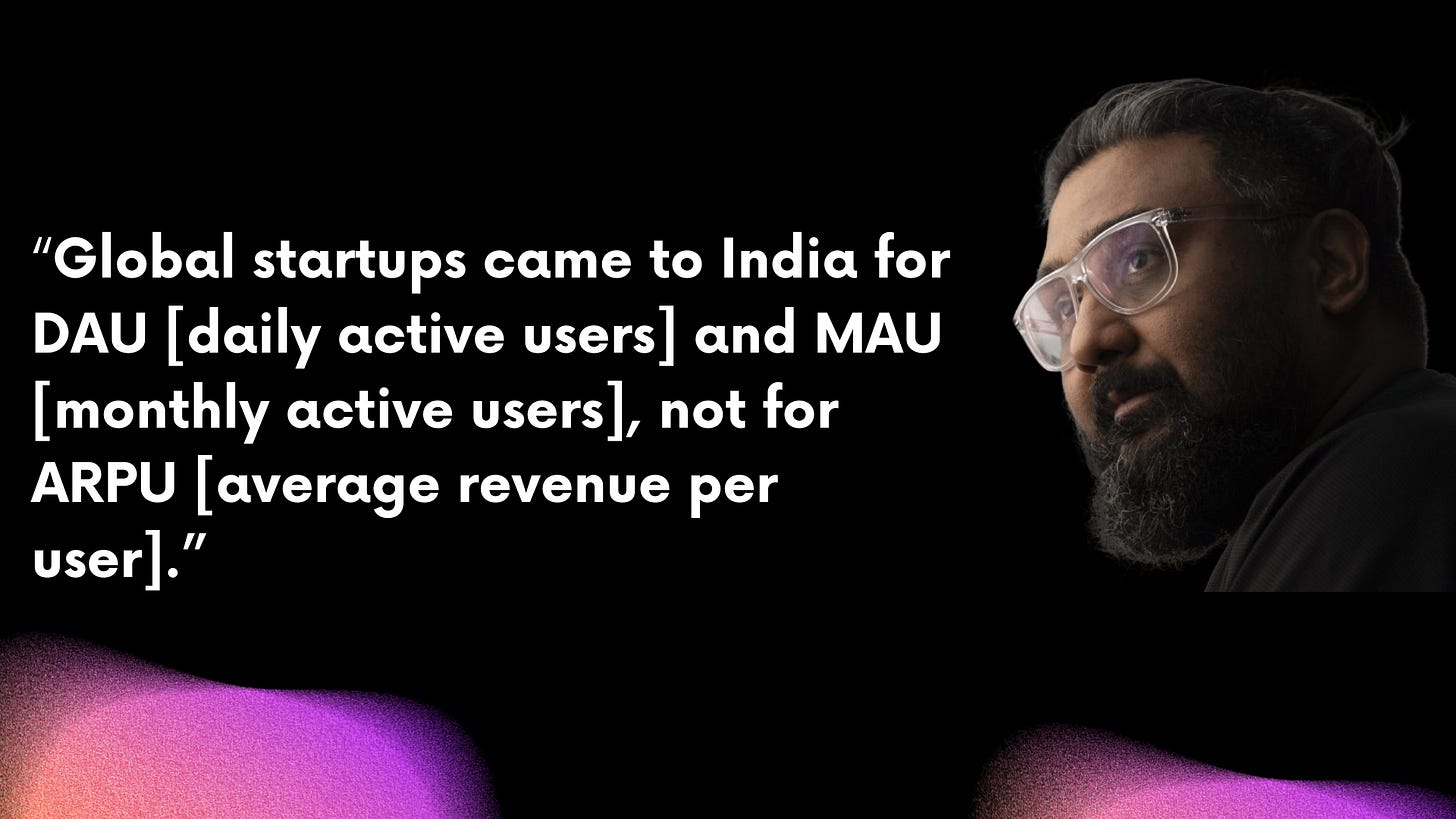
Below is an excerpt from Kunal Shah, where he shared an interesting insight about global startups:
“I realized that YouTube, Google, and all of these companies had hundreds and hundreds of millions of customers, but their ARPU was literally nothing. YouTube is used by almost every Indian, but the ARPU of YouTube in India is probably less than $2 per annum, which can barely cover the streaming cost. 😲
But these big companies don’t mind it. Because when you’re a global company, you can show 4 billion active users to the public market, and they’ll give you a better market cap for it. Your ARPU comes from America, but you get your DAU from India. When you join the numbers, they look nice.”
For example, a new SaaS startup with 100 users, a high ARPU (average revenue per user), and good profits will be positioned better than a company with thousands of DAUs (daily active users) but with lower ARPU and profits.
💡 Remember that building a data mindset is effective only when we focus on solving data-related problems. The below question is designed for exactly this kind of practice. We will address this in the last section of this newsletter.
Food for thought: When you see a headline on a news channel claiming "Party A Will Win This Election!" have you ever wondered, how could they possibly predict this outcome in a country as vast and diverse as India? Do they go and ask each and every person about their opinion of whom they will vote or want the election to win? Take a moment to consider this and keep reading to discover an answer you might find useful in various situations in your life. 🤔
Visualization Spotlight:
Human Bias Focus: Framing Effect
Did you know there are more than 180 ways your brain can trick you? These tricks, called cognitive biases, can negatively impact the way humans process information, think critically and perceive reality. They can even change how we see the world. In this section, we'll talk about one of these biases and show you how it pops up in everyday life. 🧑🏫
Have you ever noticed how the way information is presented can significantly influence your decisions and opinions? This phenomenon is known as the Framing Effect. It occurs when we react differently to a particular choice or information based on whether it is presented in a positive (gain) or negative (loss) frame, even when the result is the same. 🖼️
Understanding this bias is crucial because it demonstrates the power of language and context in shaping our decisions, often leading to irrational or suboptimal choices.
For instance -
Health and Fitness Choices 💪 :
When a food item is labeled as "90% fat-free," people are more likely to choose it over an item labeled as "10% fat," even though both phrases present the same information. The positive framing of being mostly "fat-free" makes it more appealing.
Investment Risk Perception 💰 :
Positive Frame: "This investment has a 90% chance of success."
Negative Frame: "This investment has a 10% chance of failure."
Even though both statements convey the same probability, individuals may perceive the investment differently depending on whether it's framed positively (success rate) or negatively (failure rate). This framing effect can impact investment decisions, risk tolerance, and overall financial behavior.
Data Nuggets:
Okay, now let’s come to our question on how media channels predict election outcomes. Imagine you are part of their analytics team and are given the task of collecting data from the population.
While you know it’s impractical to ask every single eligible voter whom they're going to vote for. Instead, you decide to conduct a survey of, say, 1,000 voters selected randomly from various states, cities, and villages.
Now if you were to base your predictions on this small sample, there's a chance you might be somewhat accurate, but there's also a significant risk of error—especially in a country as diverse as India. Your sample might accidentally lean heavily towards urban or rural voters, young or old, or any other demographic skew.
Now, consider increasing your sample size to 10,000 or even 100,000 voters, ensuring it's diverse and representative of the entire electorate. The Law of Large Numbers tells us that the average result of these larger surveys will be much closer to the actual voting preference of the entire population. The larger the sample, the more accurate the prediction of the election outcome will be.
The Law of Large Numbers tells us that even when things seem random and messy, if we collect enough information, we start to see clear patterns. It's really important for statistics, helping us make smart choices using real data instead of just guessing. So, when you hear about surveys or predictions made from a bunch of data, think about the Law of Large Numbers and how it helps us understand the chaos around us.
Next time you encounter a survey conclusion, enhance your understanding by asking these two critical questions:
What was the total number of participants in the survey?
Did these participants accurately reflect the overall population?
That's a wrap for today! We've broken down data concepts to their basics and will keep at it. If you've found value here, please subscribe and share it with your friends—it motivates us to deliver more. Reading in an Uber? Hope it's smooth sailing without the peak-hour traffic. Until next time, stay curious and connected. Cheers! ✨
Visualization Source - https://www.nber.org/system/files/working_papers/w22627/w22627.pdf


Loved the examples on framing effect bias, it is very relatable.
Great read!! Food for thought for upcoming articles - how FMCG’s play around with pricing their smaller and bigger variants of same product. Does buying smaller variants save you more money or bigger variants with deals are better choice.