From Funnel Tactics to Fox Tales: Uncover ROI and Mind Tricks! 📊🦊
Also, let's learn about what is CPM and Normal Distribution
Hello, data enthusiasts and curious minds!
Welcome to our 6th edition of DataPulse Weekly, where we unravel the magic behind data and its impact on our daily lives.
Each newsletter promises to be a journey through the fascinating intersections of data, stories, and human experiences. Whether you're an analyst, or simply curious about how data shapes our world, you're in the right place.
Let’s dive straight into today’s Data Menu -
Today’s Data Menu
Data Case Study: Breaking down the conversion funnel
Metric of the Week: CPM
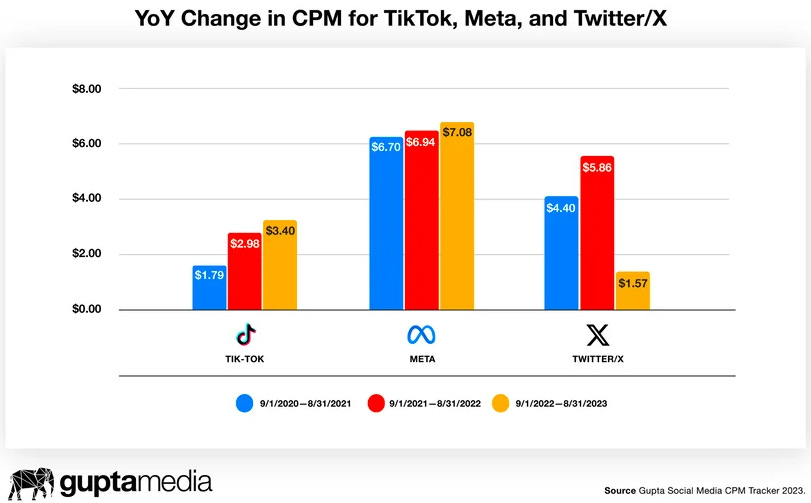
Visualization Spotlight: CPM by Ad Platforms
Human Bias Focus: Cognitive Dissonance
Data Nugget: Normal Distribution
Data Case Study:
Imagine you're a performance marketing analyst tasked with managing ad campaigns for Amazon on Instagram. How do you ensure your ads perform well and discover opportunities to boost your ROI?
This is where the conversion funnel comes into play.
In today’s case study, we will not only clarify “what” a conversion funnel is and “why” it's crucial but will also show you how analyzing these funnels by audience segments can pinpoint your ideal customers, enhancing targeting and boosting return on investment. Audiences can be segmented based on multiple variables, such as age, gender, and location. Learn more about this here.
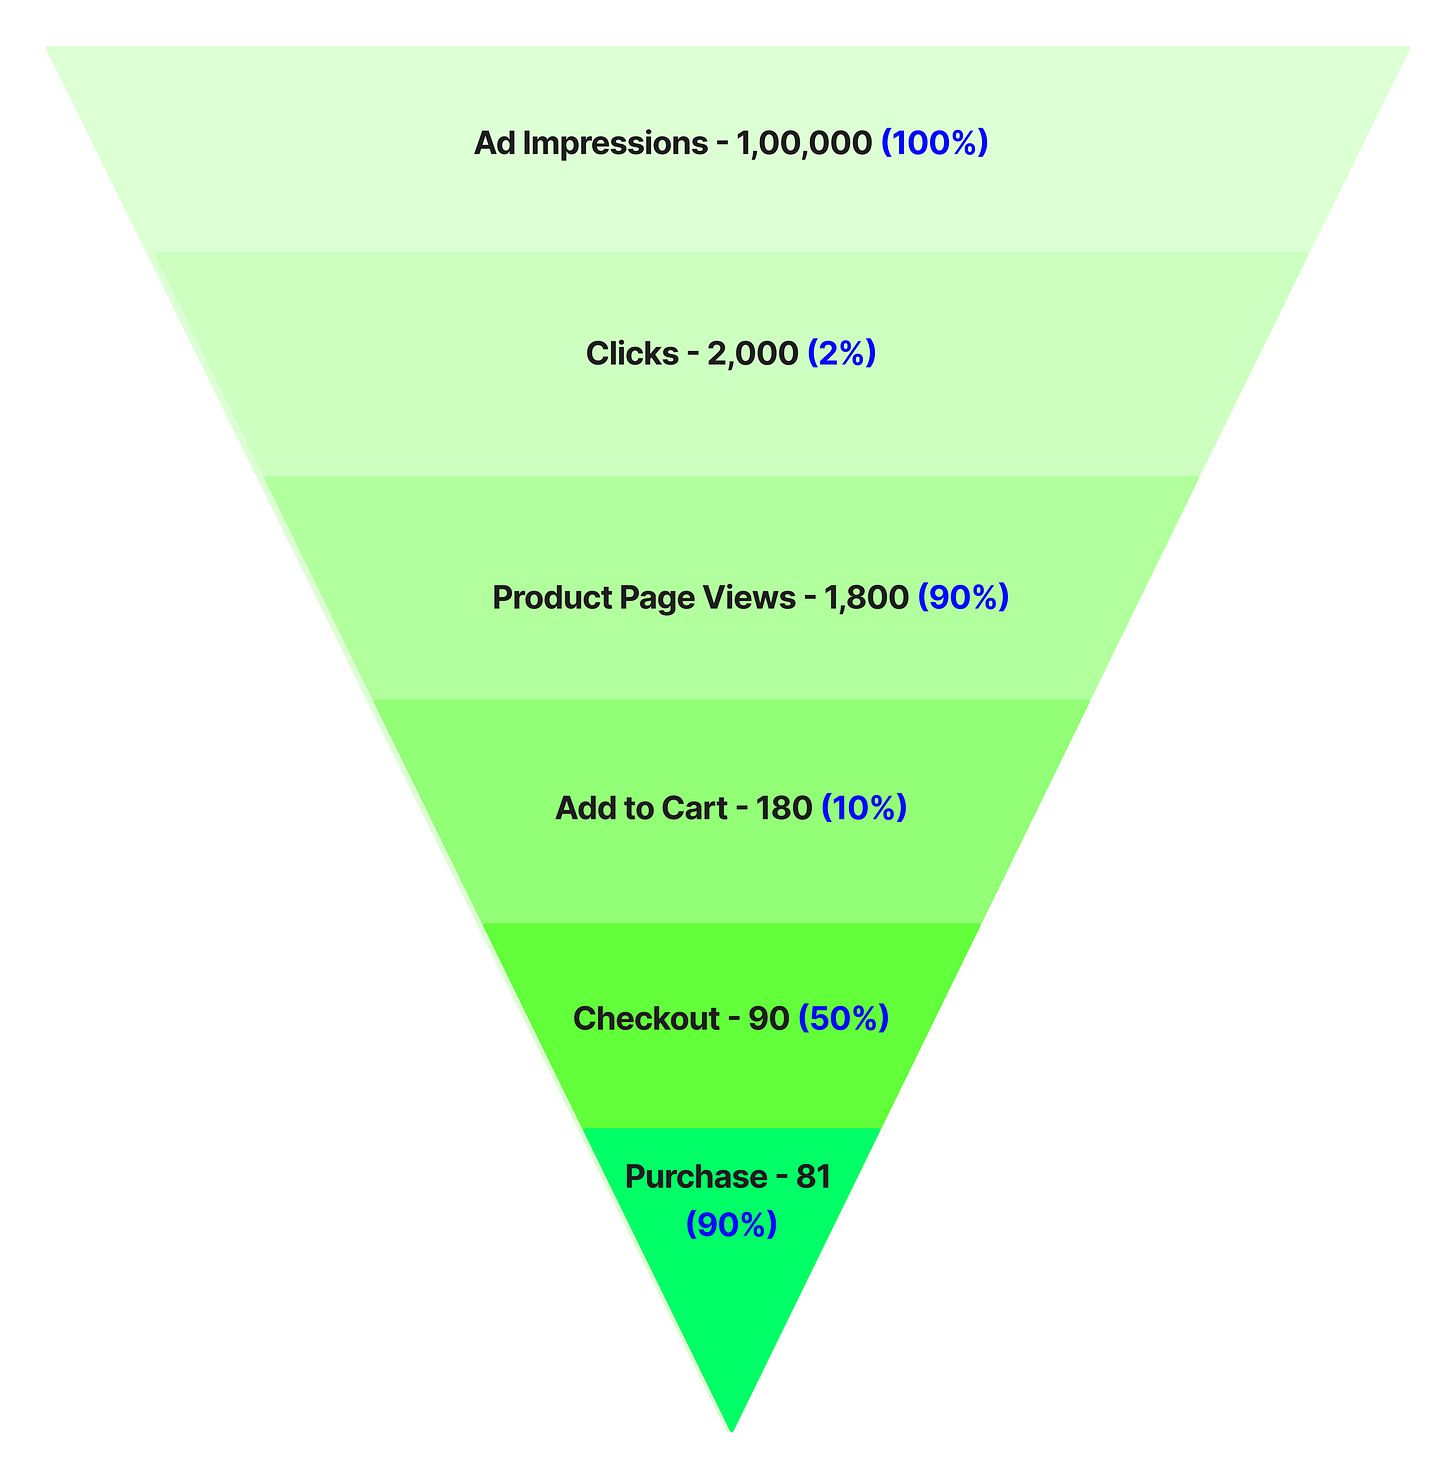
Let’s examine the conversion funnel using Amazon as an example. Imagine you’re browsing Nike shoes on Amazon but don’t make a purchase. Soon, you start seeing ads for those shoes all over the internet, including on Instagram. Here’s how the funnel from ad view to purchase might look:
Ad Impressions → Clicks → Product Page Views → Add to Cart → Checkout → Purchase
This e-commerce conversion funnel outlines the steps a customer takes from encountering an online advertisement to completing a purchase. Each stage of the funnel represents a crucial transition in the customer's journey, aimed at moving potential buyers from initial awareness to a final transaction.
Consider these hypothetical numbers for each stage, with ratios calculated in comparison to the previous stage:
From impressions to purchase, the overall conversion rate is 0.081% (81/1,00,000). This metric helps gauge the effectiveness of the funnel and the return on investment (ROI) of the ad campaign.
Is this a healthy overall conversion rate? If not, how would you identify issues within the funnel and prioritize which drop-offs to tackle first? For example, should the significant 98% drop-off from Ad Impressions to Clicks be a focus? Let’s understand this.
A structured approach to addressing these questions begins with benchmarking, which provides a standard for what an ideal funnel should look like. There are three ways to benchmark:
Compare the performance of this ad with that of other Amazon Instagram shoe category ads.
Examine the industry average ratios for e-commerce Instagram shoe category ads.
Research the conversion ratios of the leading industry player in this category, who serves as the gold standard.
The first method uses readily available data. The second and third might require access to industry reports. Comparing your funnel stages with these benchmarks can help prioritize which stage to address first.
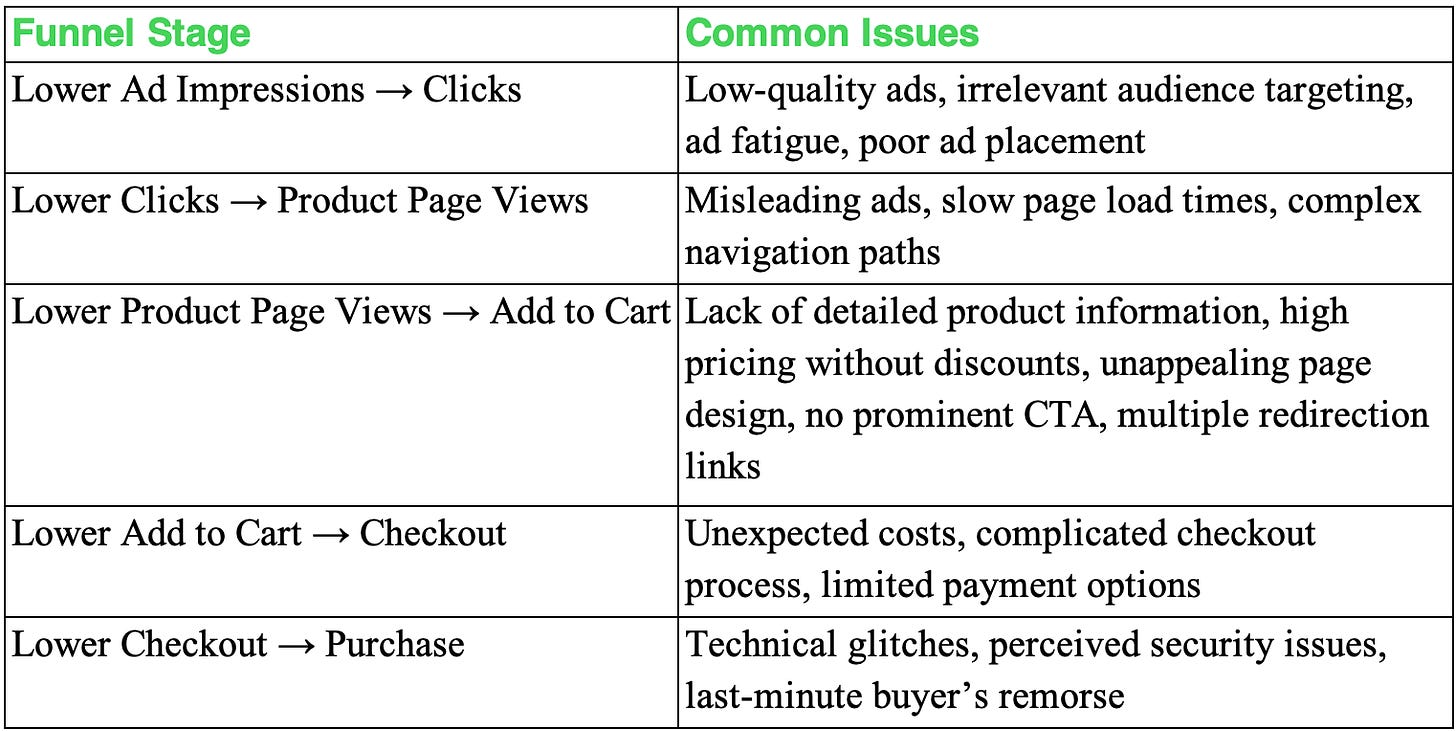
For instance, a significant difference from the benchmarked ratios in the Product Page Views → Add to Cart stage would lead us to focus on diagnosing and mitigating drop-offs at this stage. Here’s how you can drill down to single or more reasons causing drop-off in the specific stage:
Identifying and diagnosing the right stage for improvement helps enhance the overall funnel and ensures higher bucks for that dollar spent.
Furthermore, segmenting the conversion funnel by targeted audience enables accurate identification of which cohorts are most engaged and have the highest conversion rates. This targeted analysis allows you to focus your efforts on these segments, optimizing campaigns for maximum effectiveness and significantly enhancing ROI.
Key Takeaway:
This analysis of an Instagram shoe sales funnel provides a robust framework for identifying and diagnosing specific stages of drop-off, potentially leading to a higher ROI. Furthermore, analyzing the conversion rates by various audience segments would help you to tailor targeting toward your ideal customers. Consider how you might apply a conversion funnel to address a particular challenge or opportunity in your work or business.
While conversion ratios are important to analyze in the funnel journey, many other metrics play a vital role in improving the performance of e-commerce funnels. Let’s uncover one such metric - CPM.
Metric of the Week: CPM
CPM, or Cost Per Mille, stands for "cost per thousand impressions" and is a standard metric used in performance marketing to measure the cost-effectiveness of ad inventory.
Let's analyze an Amazon campaign for Nike shoes on Instagram: Amazon spent $500, garnering 250,000 impressions, resulting in a CPM of $2:
CPM= (Total Cost / Total Impressions) × 1000 = (500/250,000) × 1000= $2 CPM
Why It Matters:
CPM is essential for measuring the cost efficiency of ad campaigns and gauging how well the budget is spent on reaching the target audience. This metric is particularly valuable in a marketing funnel's early stages, helping optimize spending for maximum exposure. It is influenced by audience targeting, ad placement quality, and seasonality such as Black Friday sales which all affect campaign costs and effectiveness.
Check the insightful visualization on the CPM below.
Visualization Spotlight:
Human Bias Focus: Cognitive Dissonance
Did you know there are more than 180 ways your brain can trick you? These tricks, called cognitive biases, can negatively impact the way humans process information, think critically and perceive reality. They can even change how we see the world. In this section, we'll talk about one of these biases and show you how it pops up in everyday life.
On a warm, sunny day, a fox wandered through a thick forest, his stomach growling with hunger. Deep in the woods, he found a vine covered in dark, ripe grapes hanging from a high branch, shining in the sunlight.
Each grape looked delicious, and the fox couldn’t wait to eat them. Eagerly, he jumped up, trying to grab the grapes with each leap.
Despite his best efforts, the grapes remained just out of reach. With every jump, he grew more frustrated and tired. Finally, after many attempts, he stopped, out of breath. Looking up with a mix of disappointment and pride, he shrugged and said to himself, “Those grapes are probably sour anyway.” Then, he walked away, still hungry but keeping his pride.
This story is a classic example of cognitive dissonance, where someone feels uncomfortable because they hold conflicting beliefs or behaviors. For the fox, his belief that he could easily snatch the grapes clashed with his failure to do so. To ease his discomfort, he convinced himself the grapes weren’t worth having after all.
Implications in Everyday Life: Cognitive dissonance happens to all of us, not just in stories. It shows up when we justify a bad choice, or make excuses for actions that don’t match our values. In daily life and work, recognizing when we’re experiencing cognitive dissonance can lead to clearer thinking and better decisions. It encourages us to confront our conflicting beliefs head-on, rather than making excuses for why things didn’t turn out as we hoped.
Remember, understanding any bias is the first step to overcoming its impact on our decision-making. Learn about more biases that we covered in our previous newsletters here -
This brings us to the last section of our newsletter.
Data Nugget: Normal Distribution
Normal distribution, also known as the bell curve or Gaussian distribution, is a statistical concept describing how data points are evenly distributed around a central value. This distribution is pivotal for its symmetry about the mean, with data points decreasing in frequency as they move away from the center.
The distribution's bell shape means most values cluster near the mean, with fewer instances occurring as you move toward the extremes. In a perfectly normal distribution, the mean, median, and mode are all the same, and the curve is perfectly symmetrical.
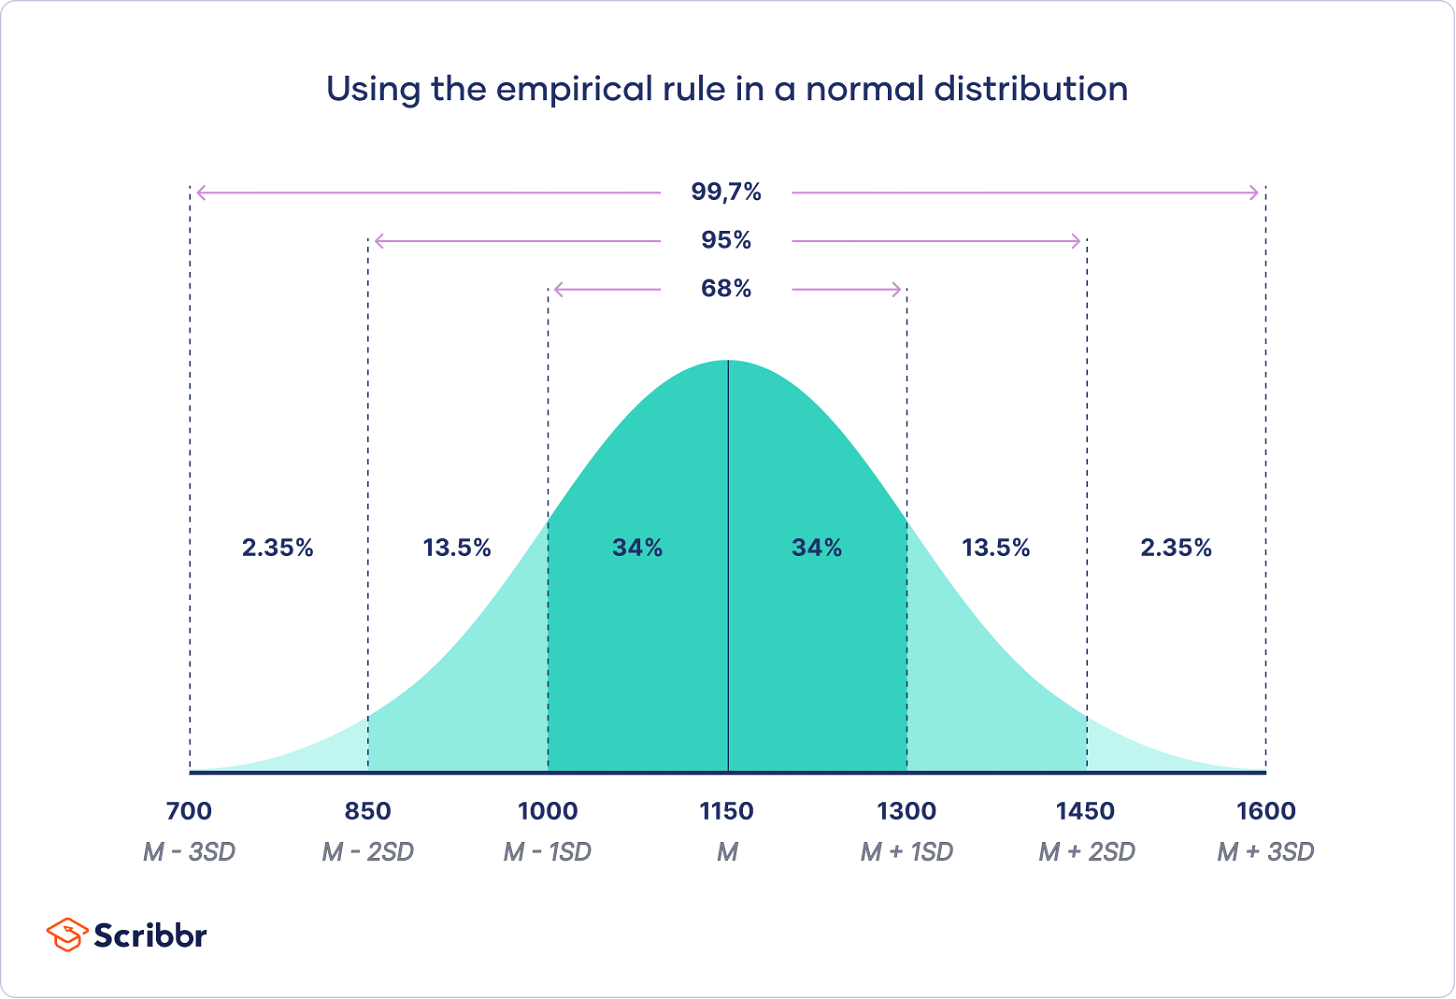
Let's explore this concept using the SAT score example from Scribbr. In this case, the distribution is characterized by a mean (M) of 1150 and a standard deviation (SD) of 150.
Understanding normal distributions is crucial because they allow analysts to make predictions about data based on the properties of the distribution. For instance, using the empirical rule (68-95-99.7 rule), we know that about 68% of the data in a normal distribution falls within 1 SD of the mean, about 95% within 2 SD, and about 99.7% within 3 SD. This helps in predicting probabilities and assessing the likelihood of different outcomes.
Understanding the characteristics and implications of normal distribution can enable analysts to summarize data effectively and identify potential outliers within the dataset.
That wraps up our newsletter for today! We've simplified intricate data concepts and will continue to do so in future editions. If you found this helpful, please consider subscribing and sharing it with someone who would appreciate it. Your support motivates us to create more engaging content. Additionally, if you've experienced cognitive dissonance in any situation, we'd love to hear about it in the comments!


Great weekend read!
Data case study was intresting! 👏